17.01.2020 Friday 11:00-12:00
I missed this lecture but went over slides before on the 16th of January. I am writing these notes on the 23rd of January before my next lecture in this module.
Basics of the ModuleAssessment
What is this Module about
The Incidence of Poverty?
The Economic Lives of the Poor
Using Household Surveys
Banerjee and Duflo (2006) “The Economic Lives of the Poor”
Notes
Lecture 1: Economic Lives of the Poor
Basics of the ModuleBasics of the Module
There will be 11 lectures in total, including this one. The readings for each week can be found in the module outlines. It is advised to do some of the reading before the lectures every Friday.
There are 5 seminars in total, so alternating every other week. I am in group 02 meeting Fridays between 15:00-16:00. We will be solving problem sets during the seminars.
We will be reading chapters from the textbook Development Economics by Debraj Ray, which is the same book we have used in the Development Economics module in the autumn term. Additionally, we will read from journal articles, chapters from the ‘Handbook of Economics’, and other books. This can all be found in the module outline on Moodle.
AssessmentAssessment
There will be 2 assignments, due in Week 18 and Week 22, which are supposed to provide essay-style answers to a number of questions. Each assignment is worth 10% of the final mark of this module. The assignment questions will be posted on Moodle 3 or 4 weeks before each of them is due.
– note the deadlines given in the module factsheet are different, (week 20 and week 24). Which one is right? –
The final assessment is the summer exam in May which will count for 80% of the final mark. The final exam will also require essay-style answers. The approach to the final exam will be similar to the approach used to answer the assignments. Use the assignments to prepare for the work during the exam. Learning to be comfortable with the assignments will make you more comfortable with the final exam questions. On Moodle, there are some sample questions for the final exam.
What is this Module about?What is this module about?
What is meant by the ‘Microeconomics of Development’? The autumn term ‘Development Economics’ class is not a prerequisite for this module, but it is useful as a reference. Traditionally the field of development economics is macro-based. Economic growth or industrialisation (sectoral transformation) are traditional measures of development. With these factors as measures of development, typical policy targets are investment and (international) trade. The instruments used in these policies include adjustments to interest rates, exchange rates or taxation.
By contrast, microeconomics of development is concerned with welfare, constraints and choices at the individual level. It looks at the incidence of poverty or life expectancy as measures of development, instead of growth and industrialisation. In this situation health and education are policy targets. Health and education have a more direct relationship with poverty.
In this module we are assessing:
- The quality of life of individuals
- The constraints they face and the choices they make that prevent them from improving their own situation
- Policies and programmes that can have a positive impact, by removing those constraints or enabling individuals to make better choices
These changes in choices individuals are making can also have an effect on the macro level of development, like an increase in the savings rate and investment in the economy as a whole.
Outlines of lectures. (In the module outline you can find a description of each topic and reading assigned to each topic):
1. Economic Lives of the Poor
This topic is continued further in this lecture.
2. Household Surveys
3. Empirical Methods
In recent years, we have been able to obtain more data regarding choices on the micro level, as opposed to only having macro data in the past.
4. Market Failure
5. Financial Markets
6. Land and Labour Markets
7. Risk and Strategies for Coping with Risk (Insurance Markets)
These next 4 lectures are about the theory behind how we understand the poverty in developing countries, which generally revolves around market failures. Each lecture will be about market failures regarding a specific factor of production. We will also discuss the implications of market failures and the policies used to address these issues.
8. Individual Behaviour under Poverty
9. Gender and Decision-Making within Households
10. Social Networks
11. Culture and Institutions
The last 4 lectures are about decision-making and social interaction at different levels of an economy or a society. Behaviour and decision-making might be different under poverty. The implications of decision-making within households on poverty and inequality. Furthermore we will look at social networks, so groups of people who don’t live together, but are socially connected and what kind of social interactions they have and the implications of economic decision-making, why they should be taken into account when creating policy. The final topic is about shared culture or beliefs and how they affect economic decision-making and its influence on development.
When there are no market failures, the different social levels don’t have as much of an effect on decision-making in developing countries relative to developed countries. Because there are market failures, we need to be aware of the various effects of each topic.
The Incidence of PovertyThe Incidence of Poverty
The aim is to understand the causes and possible prescriptions for poverty.
The topic of this lecture is the economic lives of the poor. To start with a description of the lives, we should note that there are large variations between average income levels across different countries in the world.
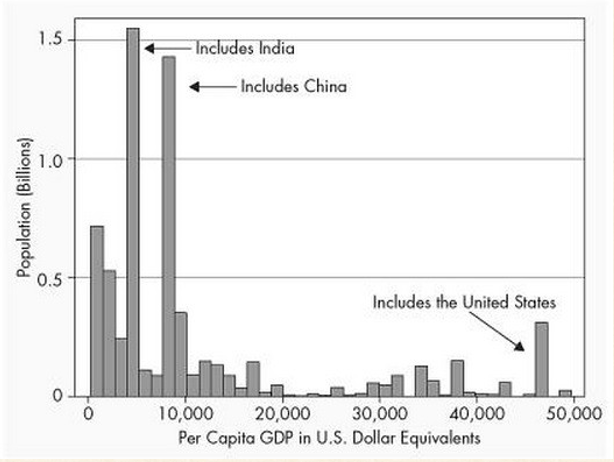
The diagram shows that a large majority of the world population makes on average 10000 per capita GDP in USD, and this is mainly driven by the extremely large populations in India and China. There is also a substantial level of people that makes more on average and this group is mainly driven by the large population of the United States.
However, it is important to note that even in countries where the average per capita is very high, there will still be a significant amount of the population making less than the country’s average, as there can be a high disparity in incomes within a single country.
To be able to determine how many poor people live in what countries economists use various measures of poverty based on the amount of spending per person per day. This is because just using average income does not show the income disparity within a country. A Poverty Count is based on a specific income threshold and a measure of the extent of poverty.
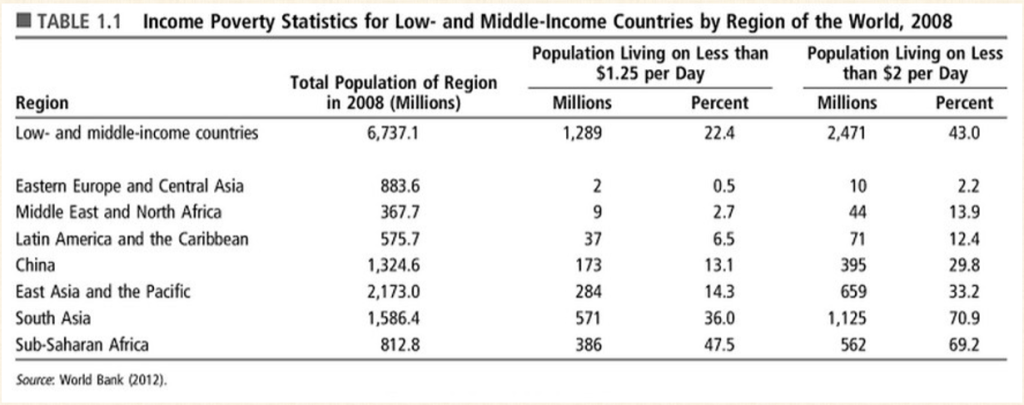
The definition of living in extreme poverty uses a threshold of 1.25 USD per day, while moderate poverty uses a threshold of 2 USD per day. These thresholds will vary over time.
Looking at the poverty head count gives a different view than just looking at average GDP per capita in a country.
For example we can observe this discrepancy by comparing South Asia and Sub-Saharan Africa. The average GDP per capita in South Asia is a lot higher than that of Sub-Saharan Africa, yet the poverty head count percentage of these regions are quite similar and in fact South Asia has almost double the total amount of people living in moderate poverty. We can conclude that income inequality and the size of a population has an impact on how we will view poverty.
This gives us a slightly better picture of where poor people live, but more factors need to be considered. One reason for this is that having the same level of income does not necessarily equal the same quality of life in different regions of the world and people may have vastly different experiences regarding accessibility to health services, education, sanitation, etc. Additional living standards indicators need to be included to give a more accurate picture.
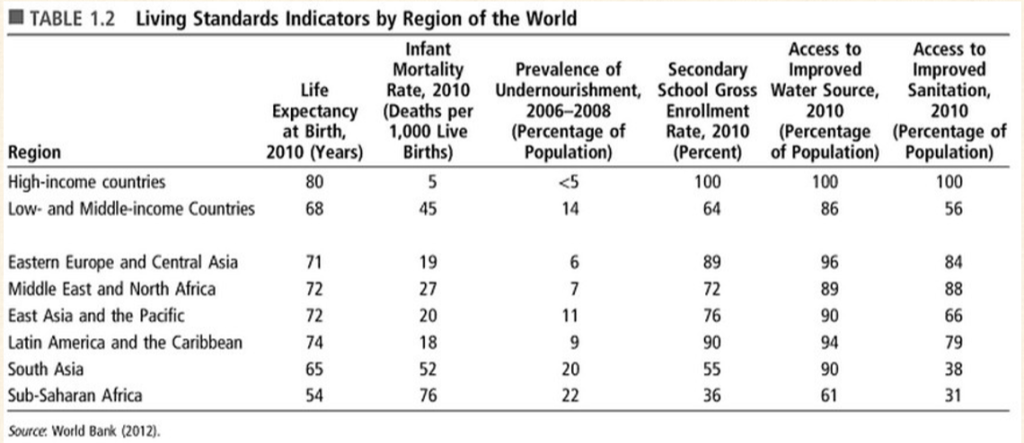
Countries can again have similar average GDP rates and similar poverty head count rates, but vary according to these living standards indicators.
Levels of malnourishment are quite similar for South Asia and Sub-Saharan Africa, while the average GDP per capita rates are quite different.
Another example can be seen when we compare Eastern Europe and Central Asia with Latin America and the Caribbean. The latter has a high poverty head count rate in comparison to the former, but in actuality the quality of life might not be as different as we might initially assume, because we can see that the living standards indicators are quite similar.
The Economic Lives of the PoorThe Economic Lives of the Poor
It is important to note that the thresholds we have for poverty head counts are just an average over a period of time. It does not mean that an individual will have that amount to spend every day. It is possible that some days their spending is zero.
What does it mean to live under the poverty threshold? What are the constraints that these people face?
Questions about Economic Lives
Economic lives of the poor in developing countries are very different from well-off individuals from richer countries, but we start by asking the same basic questions. The fundamental economic questions to understand their economic lives are the same, which might be a very different approach than for example in anthropology.
Some questions to consider:
- How do they earn a living?
- Do they hire out labour?
- Engage in home production? Do they participate in the market?
- Act as entrepreneurs?
- What productive assets do they use in making a living?
- How do they obtain these assets?
- How do they protect themselves from adverse shocks? E.g. bad weather, poor health?
- How do they save for the future?
- Make provisions for their old age?
- Who do they transact with? E.g. to sell their produce, or hire labour out, or obtain credit, or raw materials for production?
Using Household Surveys
Journalists and travel writers may draw up a portrait which can address some of these questions, but it might not be a good representative. How would we know if this particular story is exceptional or ordinary? It might still be a very accurate account of a single case which can be useful, but might not be relied on if you want to create policy for a larger group.
Household surveys are much more useful if you want data that is a good representation of the population. It collects detailed information on a representative sample of households, including characteristics of household members, employment, assets, consumption, production etc. and may be used to make general assumptions about the population.
Banerjee and Duflo (2006) “The Economic Lives of The Poor”Consumption
Assets
Banerjee and Duflo (2006) “The Economic Lives of the Poor”
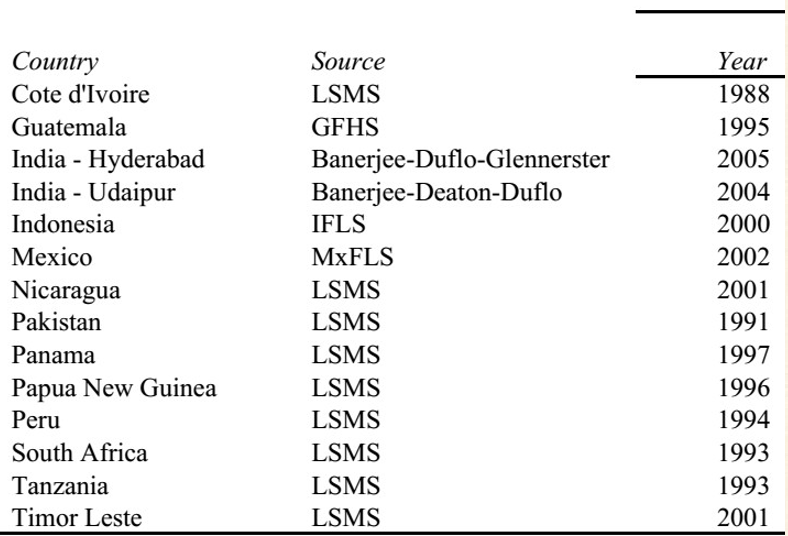
Application: Banerjee and Duflo (2006) use household surveys from 13 different countries to present a detailed portrait of the economic lives of the poor comparing living on less than $2 and $1 a day
http://economics.mit.edu/files/530 is encouraged to read, as it is not a very technical paper and should not be too difficult to understand.
These researchers shifted the focus of developmental economics to how to address poverty. The analysis was based on 14 household surveys listed below with the focus on the ‘extremely poor’ with an average per capita consumption of 1.08 USD per day and the ‘poor’ with an average per capita consumption of 2.16 USD per day (using 1993 PPP exchange rate).
Consumption
“the average person living at under $1 per day does not seem to put every available penny into buying more calories. Among our 13 countries, food typically represents from 56 to 78 percent among rural households, and 56 to 74 percent in urban areas”
Given that they do not have a lot to spend, you might assume that they would use a higher percentage of their resources to improve their calorie intake, but this is not what we find. In some of these countries a substantial percentage of their budget actually goes to tobacco and alcohol, which we assume to be non-essential for their health and nourishment.
“The extremely poor in rural areas spent 4.1 percent of their budget on tobacco and alcohol in Papua New Guinea, 5.0 percent in Udaipur, India; 6.0 percent in Indonesia and 8.1 percent in Mexico; though in Guatemala, Nicaragua, and Peru, no more than 1 percent of the budget gets spent on these goods”
This is all for individuals with a budget of under $1 a day on average.
Assets“… it is hard to escape the conclusion that the poor do see themselves as having a significant amount of choice, and choose not to exercise it in the direction of spending more on food”
